
We open the Urban Planning Geoportal to check if a plot is buildable, and we come across a red area bordered by green hatching with no readable explanation. The next reflex is to close the tab and call the town hall.
The legend of the Urban Planning Geoportal is not complex in itself, but it mixes color codes from the PLU, overlapping easements, and overlapping regulatory perimeters. Knowing how to read these layers prevents wasting several weeks on a poorly oriented project.
IGN Geoportal and Urban Planning Geoportal: two tools not to be confused
The most common confusion in the field is believing that you are consulting the right portal when you are on the wrong one. The IGN Geoportal (geoportail.gouv.fr) displays cartographic backgrounds: cadastre, orthophotos, contour lines. It shows the boundaries of a plot, the topography, and existing buildings. The Urban Planning Geoportal (geoportail-urbanisme.gouv.fr), on the other hand, centralizes enforceable urban planning documents: PLU, PLUi, municipal maps, public utility easements.
To decipher an urban planning plan, we need both portals used together. The first provides the base map and the cadastral plan, while the second overlays the regulatory zoning and prescriptions. Without the cadastral background, you cannot locate the plot. Without the GPU, you do not know the rules that apply to it.
Since January 1, 2023, it is the publication on the Urban Planning Geoportal that determines the legal enforceability of a PLU or a SCoT, in accordance with ordinance no. 2021-1310. A zoning not published on the GPU may no longer be enforceable against the applicant, even if it appears on a paper document at the town hall.
When preparing a file, you must ensure to understand the legend of the Geoportal as it is published online, and not rely on an old or printed version.

Zones U, AU, A, N: decoding the colors of the PLU zoning
On the Urban Planning Geoportal, each PLU zone is represented by a standardized color code. There are four main families of zones, and this is the first level of reading to master before looking at the details.
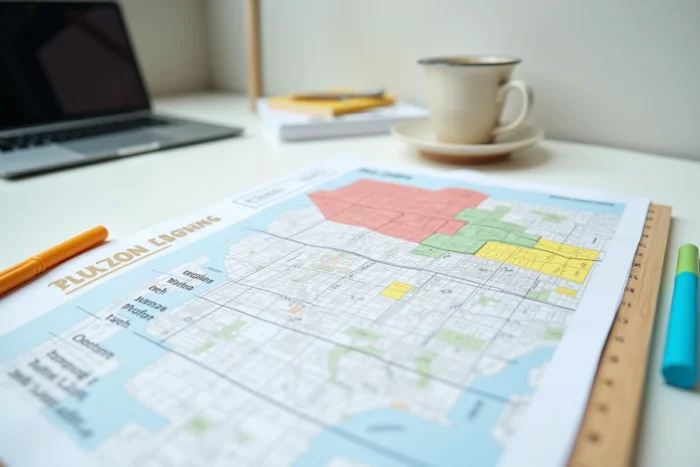
- Zone U (urban), in red or reddish-brown: sector already equipped with networks (water, sanitation, roads). Construction is generally allowed there under the conditions of the zoning regulations.
- Zone AU (to be urbanized), in yellow or orange: land intended to accommodate new constructions. We distinguish between “open” AU zones (buildable immediately if networks are at the edge) and “blocked” AU zones (deferred urbanization, requiring a modification of the PLU).
- Zone A (agricultural), in pale yellow or light green depending on the representations: reserved for agricultural activity. Only constructions related to agricultural exploitation are allowed, except for very tightly regulated exceptions.
- Zone N (natural and forestry), in green: protection of natural spaces. Buildability is almost nil, limited to a few cases (measured extension of an existing building, public equipment).
These colors follow a national convention included in the official GPU legend, but their exact shade may vary slightly from one document to another. It is the zone code (U, AU, A, N) that prevails, not the shade displayed on the screen. Click on the zone to display the label and access the associated regulations.
The sub-sectors not to be ignored
Each zone can be divided into sub-sectors (UA, UB, UC, 1AU, 2AU, etc.). Two neighboring plots classified in zone U may have completely different height, footprint, or setback rules depending on their sub-sector. The field reflex is to never stop at the color: always open the written zoning regulations.
Easements and prescriptions: the layers overlaid on the zoning
Zoning alone is not enough to know what can be built. The Urban Planning Geoportal also displays public utility easements (SUP) and prescriptions that overlap the zoning plan. This is often where projects become complicated.
The hatching, dotted lines, and colored perimeters we see over the zones correspond to specific constraints. For example, there are protection perimeters for historical monuments (radius around a classified building), urban preemption zones, areas subject to flood risk, or reserved locations for future public facilities.
Each easement layer has its own entry in the legend. To access it, use the side panel of the GPU and activate or deactivate the layers one by one. Overlaying all layers at once makes the map unreadable. The right method: first display the zoning alone, identify the zone of the plot, then activate the easements layer by layer to see which ones cross the land.
Surface and linear prescriptions
The prescriptions of the PLU appear in the form of surfaces (patterns or semi-transparent areas) or lines (alignments, mandatory setbacks). A “garden” pattern superimposed on a U zone, for example, may prohibit construction on part of the plot. These prescriptions are not always visible at first glance if you do not zoom in sufficiently.
Migration to cartes.gouv.fr: what changes for reading plans
The historic IGN Geoportal is being replaced by cartes.gouv.fr, with a closure announced for September 2026. The interface is changing, as is the organization of layers. The tutorials and screenshots found online today are likely to become obsolete quickly.
The Urban Planning Geoportal (GPU) remains a distinct portal for now. Feedback varies on whether the ergonomics of the GPU will evolve alongside this migration. What does not change is the reading principle: identify the zone, read the code, open the written regulations, check the easements layer by layer.
For a construction or extension project, the legend of the Urban Planning Geoportal is just an entry point. It provides the applicable regulatory framework for the plot, but the zoning regulations remain the document to read in full. Cross-referencing the reading of the GPU with the cadastral plan and, if necessary, with a planning certificate requested at the town hall, remains the most reliable approach to secure a project before submitting a permit.